
When it matters: No fixed date. Worth repeating each quarter, and whenever a price or a main cost changes.
Does this fit you?
- You sell more than one product or service and are unsure which ones pay.
- You know the business's total profit but not the profit on each sale.
- You are about to review a price, take on a large order, or drop a line.
- You want a rough figure for how much has to be sold each month to cover the fixed costs.
What it could be worth
Knowing the margin on each product or service shows where the business's profit comes from, which is rarely evenly spread. That changes which work to chase, which prices to review first, and what a large discount really costs.
The break-even estimate gives a monthly sales figure to set beside the actual one. A month below it is not a crisis, but a run of them is a reason to look at prices, costs or overhead before the bank balance does it for you.
What this produces: the filled-in cost and margin worksheet for one period, the product or service with the lowest margin identified, one question to take further (often into a price review), and the date to repeat it.
| Service A: price $150, direct cost $60 | gross margin $90, or 60% |
|---|---|
| Service B: price $100, direct cost $70 | gross margin $30, or 30% |
| Monthly overhead | $6,000 — rent, insurance, software, salaries not counted as direct |
| Average gross margin across the mix | 50%, if sales are split evenly between the two |
| Monthly break-even, roughly | $6,000 ÷ 50% = $12,000 of sales a month |
Round illustrative numbers for an imaginary business, not an industry figure. The average margin depends on how much of each service sells, so if most sales are Service B the average falls and the monthly break-even rises. No tax is in any of these figures.
How it works
SBA guidance, not a tax rule: “Then, you can use a cost-benefit analysis, or a process that helps weigh the strengths and weaknesses of a business decision, and put potential recurring benefits and cost reductions in context.”
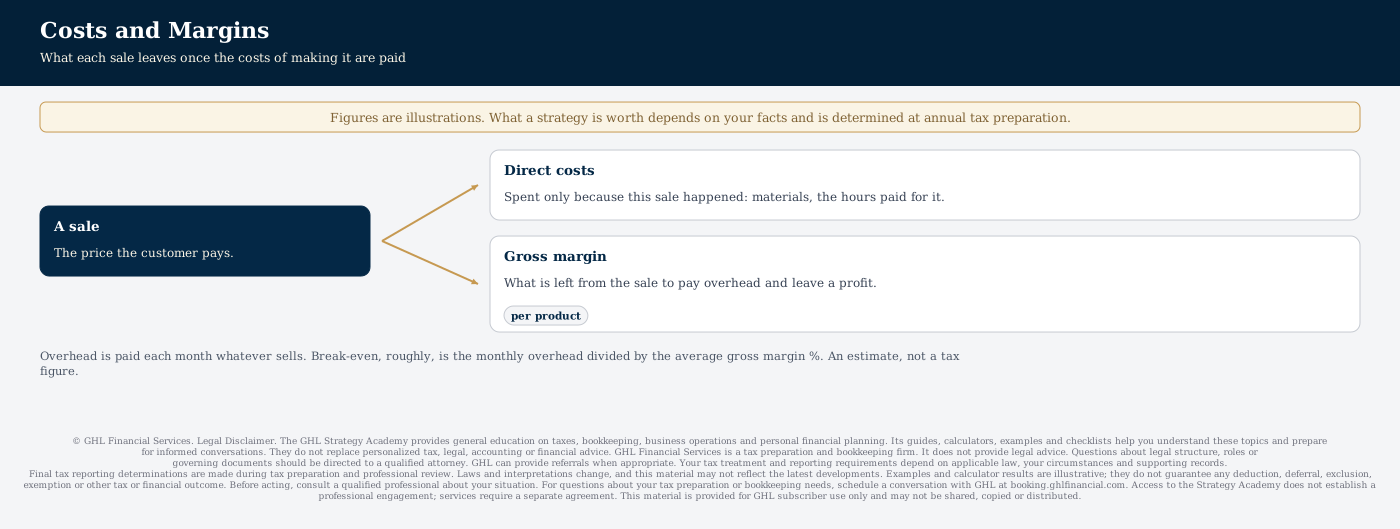
A direct cost is one the business spends only because a sale happened: materials, parts, packaging, the hours paid for to deliver it, a commission on it.
Overhead is what the business pays each month whatever is sold: rent, insurance, software, phones, salaries not tied to a particular job, loan payments.
Gross margin is the price less the direct cost. In dollars it is what one sale contributes toward overhead and profit; as a percentage of the price it lets products and services of different sizes be compared.
A low margin is not automatically a problem. A product with a thin margin that sells in volume, or that brings customers who buy something else, can still earn its place. The margin is the starting point for that question, not its answer.
The monthly break-even estimate divides the monthly overhead by the average gross margin %. It is the rough level of sales at which the business covers its fixed costs and makes neither a profit nor a loss.
Gross margin here is a management figure. How costs are classified for the tax return can be different, and that classification is not what this worksheet is for.
Sources
What you would do
- Download the cost and margin worksheet and pick one period the books cover, such as the last full quarter.
- List each main product or service with its price, the direct cost of one unit and how many were sold.
- List the monthly overhead, and decide where any in-between cost goes. Write that decision down so it is the same next time.
- Read the margins: which product or service leaves the least, and what is the average across the mix?
- Read the break-even line and set it beside an ordinary month's sales.
- Pick one question to take further, and set the date to fill the sheet in again.
Usually a week or two — mostly things you can start yourself.
Worksheets to use
- Cost and margin worksheet (XLSX). Each product or service with its price, direct cost, gross margin in dollars and percent, the monthly overhead, and a rough monthly break-even. Fill it in from the books for one period, then repeat it each quarter or whenever a price or a main cost changes.
What usually goes wrong
- Reading the total profit and missing that one product or service carries the rest. A business can be profitable overall while one line loses money on every sale.
- Leaving the owner's own hours out of the direct cost of a service, which makes the margin look better than it is.
- Putting a cost on the direct side one quarter and on the overhead side the next. The margins then move when nothing in the business did.
- Treating break-even as a target. It is an estimate that moves with the mix of what sells.
- Confusing margin with markup. A cost of $60 marked up 50% sells at $90, which is a margin of about 33%, not 50%.
Common questions
Does my own time count as a direct cost?
For a service, the hours that deliver it are usually the largest direct cost, whether they are paid to staff or worked by the owner. Leaving the owner's hours out makes the margin look higher than the work really earns, so put a figure on them and note what it was.
What is a good margin?
There is no single figure. Margins vary widely between kinds of business, and this guide does not offer a benchmark. The more useful comparison is between the business's own products and services, and between this quarter and the last.
Is this the same as cost of goods sold on the return?
Not necessarily. This is a management view built for decisions. How costs are reported on the return follows its own rules, and the two can differ.
Read next
Keeping it alive
A position is not finished when it is set up. This is what it needs each year to still be there when it matters.
- Confirm it still applies — circumstances change more often than the law does.
- Keep the record current. Filled in as the year happens it is evidence; assembled in March it is a reconstruction.
- Put the date in the calendar. This one closes at the year end and cannot be added at tax preparation.
- Ask GHL what changed for 2027. Figures move every year and rules move most years.